Scale Reliability Without Burning Out Your Team

Raia helps you scale SRE work by using agents that triage alerts, find what’s really broken, and take safe, automated actions — so your team can focus on higher-value work.
01 SRE Today

Ask any SRE what their week looks like, and the answer’s usually the same:
Too many alerts, too little time

Too many alerts

You spend hours every week triaging alerts from multiple tools that describe the same issue. It wastes time, hides real incidents in noise, and increases mean time to detect (MTTD).

Runbooks don’t match

You rely on runbooks that are outdated after a few deploys. During incidents, engineers stop using them and start guessing — increasing recovery time and risk of bad fixes.

Recurring incidents

You fix the same issues - memory leaks, failed health checks, and CPU spikes over and over. Because there’s no time to automate them safely, the same alerts keep paging people.
40
%
of the Time spent in repetitive incident response
30
%
increase in MTTR when alerts are noisy or rca is manual
1
+
incidents per week per engineer
02 Where Raia Fits In

Raia helps SRE teams handle more incidents with less manual work

Instead of chasing alerts, your team defines the logic once and agents take care of the repetitive steps that follow, helping you triage faster, find root causes quicker, automate common fixes, and document every action.
03 Where Agents Help

Raia agents handle the repetitive parts
So engineers can focus on the ones that don’t

01
Correlate alerts across systems
Agents subscribe to alert streams from tools like Datadog, Prometheus, and CloudWatch. They group alerts by common dimensions (service, namespace, region, deployment ID) and suppress duplicates.
02
Identify the probable root cause
Agents pull metrics, traces, and logs for the affected components. They compare current signals against historical baselines and recent deployments.
03
Execute predefined remediations
When a cause matches a known condition (e.g., container crash loop, full disk, high CPU), agents trigger a remediation workflow. Each action runs in a controlled environment with validation hooks and guardrails.
04
Escalate intelligently
If no matching remediation exists or the risk exceeds defined policy, the agent opens a ticket or sends a Slack alert with full diagnostic context — related metrics, logs, and last actions taken.
05
Record and version every action
All inputs, queries, and commands are captured in an immutable audit log. Each incident produces a structured record that can be reviewed, replayed, or reused to train new automation rules
04 How It Works

Raia listens, analyzes, acts, and records — always within the policies you define.

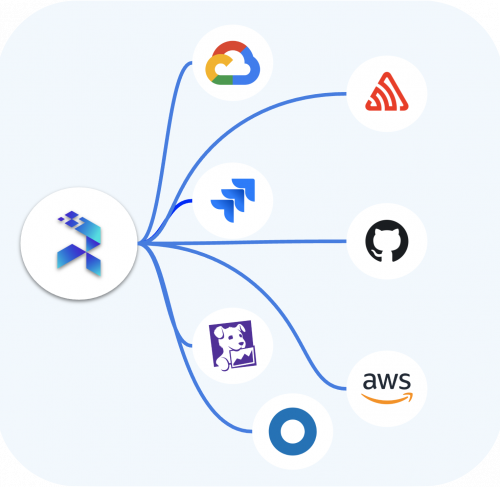
1. Connect your existing tools
Raia integrates with systems like Datadog, Prometheus, Sentry, CloudWatch, New Relic, and more.
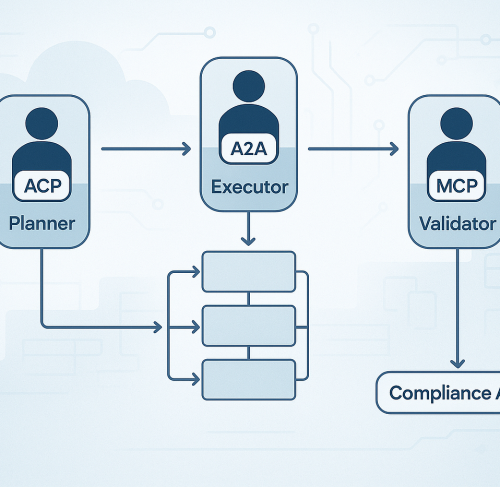
2. Define the actions
Set which workflows or actions are safe for agents to run and when they need approval.
3. Agents in action
They correlate data across tools, identify patterns, and take action where it’s safe.
4. Predefined remediations
When a cause matches a known condition (e.g., container crash loop, full disk, high CPU), agents trigger a workflow or action stored in Raia
5. Escalate intelligently
If no matching remediation exists or the risk exceeds defined policy, the agent opens a ticket or sends a Slack alert with full diagnostic context, related metrics, logs, and last actions taken.
04 A Real Example

Incident:
Latency spikes in your checkout service after a deployment.

Raia’s agents:

Correlation

By correlating Datadog metrics and AWS Lambda logs, Raia identifies a throttled DynamoDB table.

Action

Raia triggers a predefined agentic workflow to scale the aws service capacity to attend the demand.

closing

Raia monitors the service logs to validate that latency returns to normal, close the incident, and record every step
0
%
mean time spent per incident
0
%
average MTTR across recurring incidents
0
%
on-call interruptions for recurring incidents
05 FAQs

Answers You Need: Frequently Asked Questions

Get started in just a few minutes
How do Raia agents fit into our existing setup?
Agents connect through APIs to tools you already use, such as Datadog, Prometheus, CloudWatch, Sentry, Jira, Slack, and others. They don’t replace your monitoring, they act on the data it produces.
What kind of actions can agents take?
Anything that can be automated safely. Common examples include restarting pods, scaling services, rotating unhealthy nodes, or clearing stuck queues. Each action runs within a workflow you define, with verification steps built in.
How are actions controlled and approved?
All actions are gated by policies. You decide which playbooks run automatically, which need approval, and which can only suggest next steps. Every command, output, and verification is logged in an audit trail.
What happens when an agent encounters something new?
If the issue doesn’t match a known case, the agent escalates it by creating an incident in Slack, Jira, or PagerDuty with correlated logs, metrics, and a hypothesis of what’s failing. The goal is to save the team time setting context, not to guess blindly.
Can we audit what agents did during an incident?
Yes. Every query, command, and result is recorded. You can replay the sequence to see what triggered, what changed, and how metrics evolved before and after each action.
Does Raia support MCP connections and APIs directly?
Yes. Raia supports both Model Context Protocol (MCP) connections and native API integrations with selected connectors. This allows agents to communicate securely with your existing data sources, pull context, and trigger actions across systems without custom middleware or manual API orchestration.
06 Blog

Explore Insights, Tips, and More